Warehouse Job Openings Fell 17 Percent in July. So Did Layoffs.
A BLS release and a robotics trade group's own order data both moved the same week, and both got used to win an argument neither number actually settles. Reading openings, quits, and layoffs together, alongside what the robotics industry itself is ordering, tells a more honest story about where automation actually stands.

Two data releases landed nine days apart this month, one from a US government agency and one from the robotics industry's own trade group, and social media used both to settle an argument neither release was built to settle.
On September 1, the Bureau of Labor Statistics published its July Job Openings and Labor Turnover Survey. Job openings in the government's transportation, warehousing, and utilities category, the line that houses most warehouse jobs alongside trucking and utility work, fell from 383,000 in June to 316,000 in July, a drop of about 17 percent in a single month, seasonally adjusted. Robotics skeptics and robotics boosters both reposted the chart. One side read it as proof that warehouse automation is finally hollowing out hiring. The other read the same line and argued the opposite: openings this thin mean the robots have not actually shown up at scale, or hiring would have collapsed even further than it did.
Both readings are incomplete, and the same BLS release proves it, because job openings were not the only number that moved that month.
The two lines nobody screenshotted
Quits in the same category fell too, from 167,000 to 157,000, down 6 percent. Layoffs and discharges fell as well, from 120,000 to 104,000, down 13 percent. All three series moved in the same direction, together, in the same month.
That combination has a name, and it is not automation. A market where a specific job category is being substituted by machines shows divergence: layoffs rise while openings fall, because employers are actively removing roles rather than simply declining to add them, and quits tend to fall too, but for a different reason, because workers who might otherwise leave are staying put out of fear there is nowhere better to go. July's data shows something plainer. Openings down, quits down, layoffs down, all at once, is the signature of a labor market that is quiet on every axis, not one being restructured around a specific technology.
A labor market being automated and a labor market that is simply tired do not draw the same shape. Only one of those two shapes showed up in the BLS release.
What the robots themselves were doing in the same window
Nine days earlier, the Association for Advancing Automation, the North American robotics trade group, published its own second-quarter order data. North American companies ordered 8,940 robots worth US$622 million in the second quarter, up 4.3 percent in units and 21.3 percent in revenue from a year earlier. That brought first-half 2026 totals to 17,995 units worth US$1.166 billion, up 2.0 percent in units and 6.6 percent in revenue over the first half of 2025.
Two percent unit growth is not the acceleration a casual reader of humanoid-robot headlines would expect. It is also not nothing, and where the growth is concentrated matters more than its headline size. Automotive OEM orders, the segment most people picture when they hear "industrial robot," fell 25 percent year over year. Non-automotive customers accounted for 56 percent of second-quarter unit orders. Semiconductor and electronics orders grew 35 percent, life sciences and pharma grew 32 percent, automotive components grew 24 percent, food and consumer goods grew 17 percent. Alex Shikany, A3's executive vice president, put it plainly in the association's own release: "The first half of 2026 shows how the mix of the robotics market continues to evolve."
That is a rebalancing story, not an acceleration story. Robots are not sweeping through the economy at a faster rate than a year ago. They are shifting out of the sector most associated with factory-floor automation and into sectors that rarely make it into a robotics headline.
The resolution problem
Neither release, read alone, tells you what is actually happening inside a specific warehouse. This same week, a Chinese warehouse robotics vendor completed a deployment of roughly 1,500 mobile robots at a single distribution site in the Netherlands, a real, site-level substitution of labor with machines that anyone touring that building could see with their own eyes. That deployment is true. So is a national job-openings series that shows no divergence at all.
Both things are true because they are measuring different resolutions of the same economy. National JOLTS data blends every warehouse in the transportation and warehousing category, most of which have not installed a single mobile robot, with the handful of sites, like that Dutch facility, where automation has gone in hard and fast. A few thousand robots at one site change that site's headcount completely and change the national aggregate by a rounding error. Aggregate labor statistics are simply the wrong instrument for detecting early-stage, unevenly distributed automation, and treating a national average as a referendum on a technology that is still concentrated in a small number of facilities is a category error dressed up as data journalism.
I spend most of my working hours doing something close to the opposite of that: building and maintaining a taxonomy of individual robot deployments, company by company, one primary source at a time, precisely because the aggregate numbers cannot tell you which specific companies are actually automating and which are only announcing. Reading BLS releases the way robotics commentary usually reads them, as a single top-line verdict, throws away exactly the granularity that would make the number useful.
What would actually prove displacement, and why nobody has published it yet
A genuine displacement signature in data like this would look different from what July showed. It would mean layoffs rising in a specific sub-sector while openings in that same sub-sector kept falling, sustained across several consecutive releases rather than one month, with quits also falling because workers laid off from automated roles could not find comparable replacement work elsewhere in the same category. None of the three numbers in July's release did that. They all fell together instead, which is the ordinary rhythm of a labor market catching its breath after a hot couple of years, not the fingerprint of a technology in the middle of replacing a workforce.
None of this means displacement is not coming, or that it will not eventually show up in exactly this kind of government release. It means one month of synchronized softness is not that evidence, and a robotics industry order book growing 2 percent in units while rotating away from automotive is not that evidence either. Both numbers are real. Neither answers the question people keep using them to answer.
The robotics industry currently publishes more honest data about its own order book than most of the commentary written about that data's effect on someone else's job. A3 breaks its own numbers down by sector and states plainly when a segment like automotive OEM is shrinking. The BLS publishes openings, quits, and layoffs side by side specifically so nobody has to guess which of the three is doing the work in a given month. The discipline missing is not better data. It is reading three lines instead of one before deciding what a chart is trying to tell you.
The next test of this argument arrives with October's JOLTS release and the next A3 quarterly count, read together rather than separately, watching for the one combination that has not shown up yet: layoffs breaking away from openings and quits in the same direction, in the same category, for more than a single month. Until that divergence actually appears in the government's own numbers, the honest position from a market watching this industry from outside California and outside Shenzhen is that the robots are still winning site by site, one warehouse contract at a time, well ahead of any sign of it in the country's aggregate labor data.
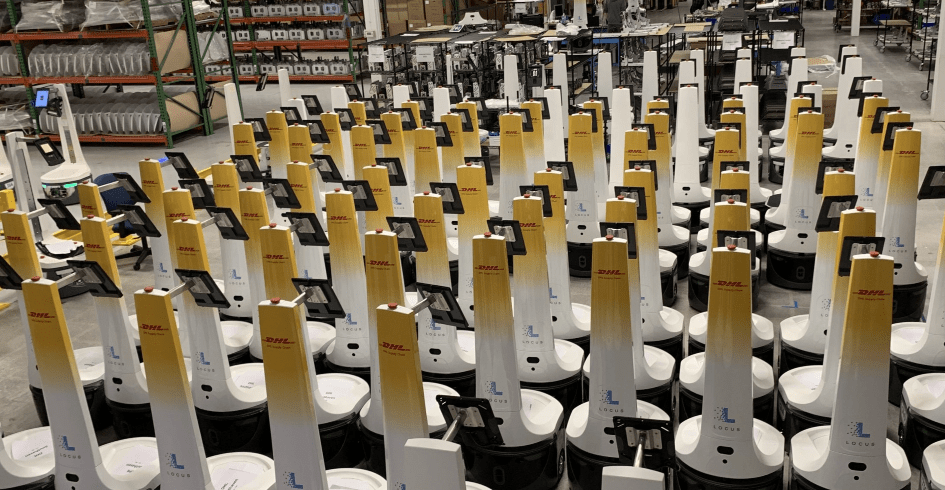
Disclaimer: This column reflects the author's own analysis and is provided for general information purposes only. It does not constitute investment, financial, legal, or employment advice. Readers should verify details with primary sources before making business decisions. Hero image: Locus Robotics mobile fulfillment robots deployed at a DHL distribution center, official Locus Robotics press photography.