Where Humanoid Robots Are Made: China, the West, and the New Production Map
A plain-language guide to the global humanoid-robot production map: China’s factory and policy momentum, the industrial automation depth of Germany and Japan, Western software and process integration, and the market-access questions buyers should ask.
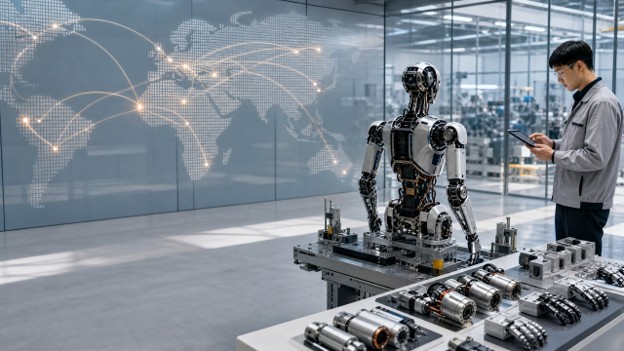
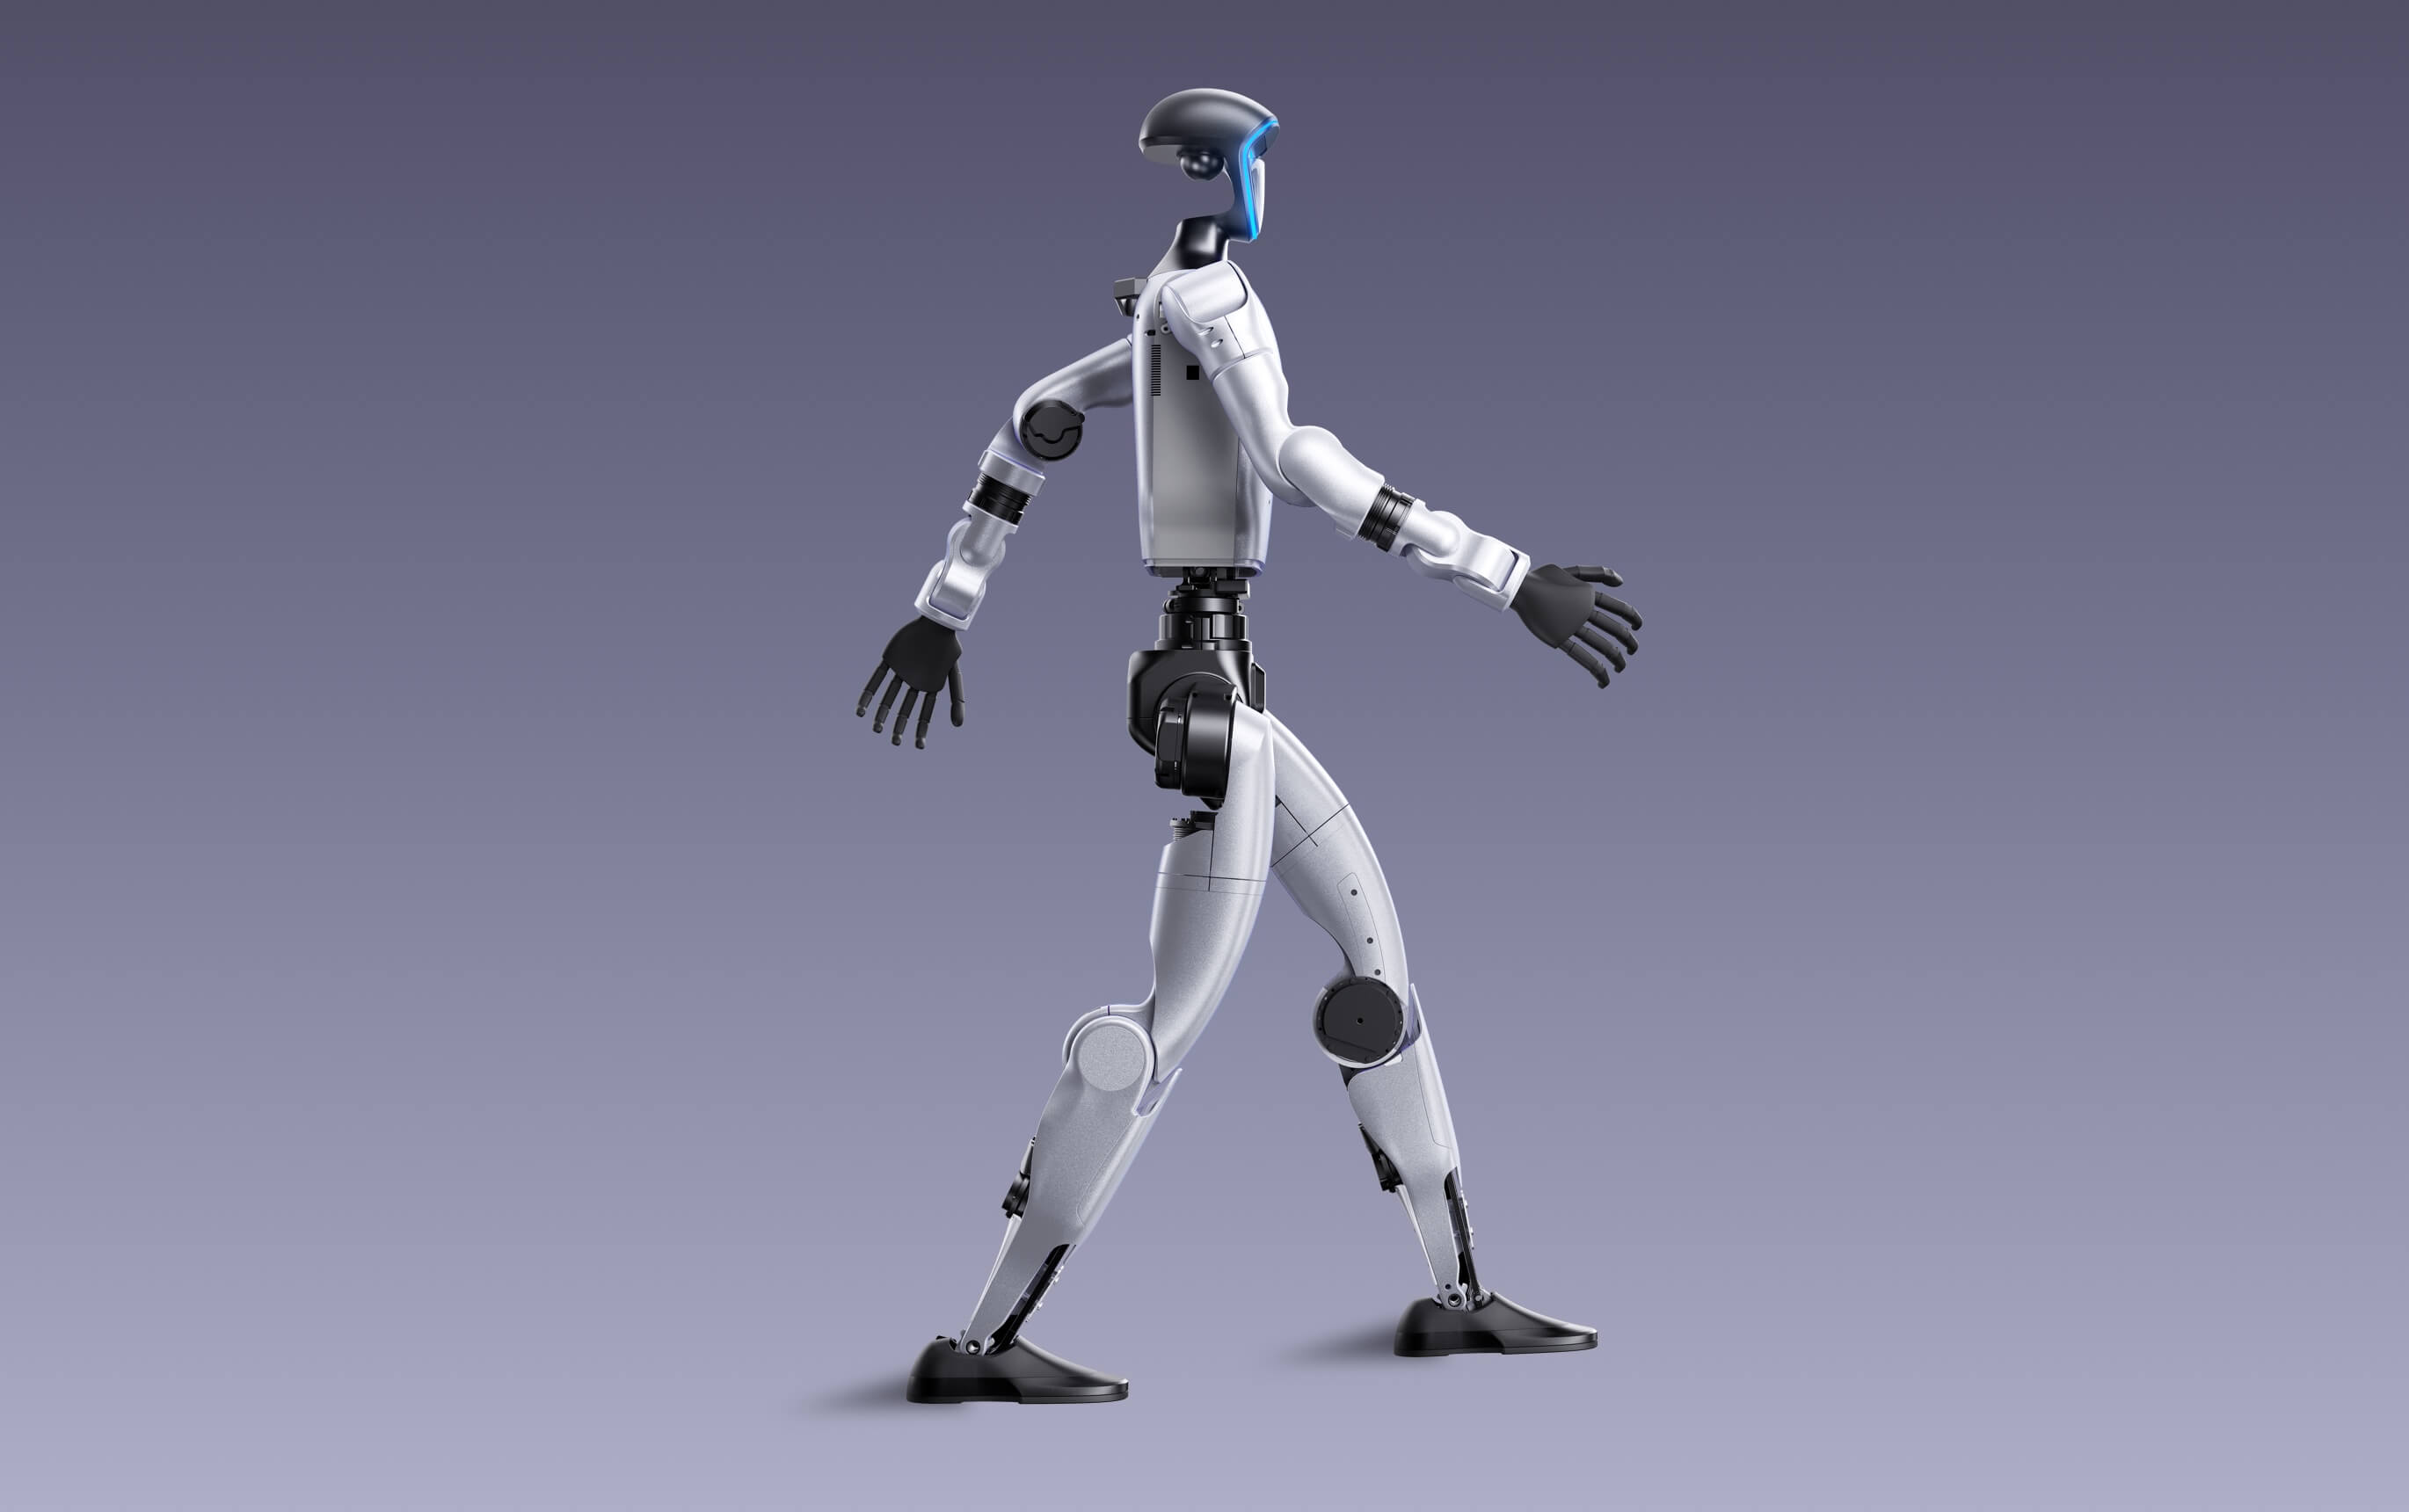
A humanoid robot is not made in one place. Its body may be assembled in a Chinese factory, its motors may come from a wider component network, its software may be trained in a customer’s plant, and its final route to market may depend on safety and communications rules in the country where it will work. The useful question is therefore not simply which country is winning. It is which part of the production map each country can control, verify, and deliver to a buyer.
China has the most visible momentum in the public record, but the available data does not support a simple global market-share claim for humanoid robots. A better explanation starts with five layers: industrial scale, components, standards, real-world training, and customer integration. The countries that combine those layers most effectively will be better positioned than countries that can announce many prototypes but cannot repeat a reliable production process.
China’s Market Share
There is no comparable official worldwide series that reports humanoid-robot revenue, shipments, installed base, or production share by country. That gap matters because a model count is not a shipment count, a factory’s stated capacity is not its utilization, and a pilot is not a commercial fleet. Any global percentage should therefore be treated with caution unless the publisher shows the same definitions, reporting period, and source scope for every country.
China’s own public record still shows why it is central to the production story. A State Council Information Office report says that the Ministry of Industry and Information Technology counted more than 140 domestic manufacturers releasing more than 330 humanoid-robot models in the preceding 12 months. The same report says that China’s first national standard system for humanoid robotics and embodied intelligence was developed by more than 120 research institutions, enterprises, and industry users. These are ecosystem indicators. They show breadth of participation and an effort to standardize the sector, but they do not prove that all of those models are in production or that China holds a specific share of global shipments.
A more concrete manufacturing datapoint comes from the Guangdong Foreign Affairs Office. It reported that an automated humanoid-robot production line opened in Foshan on 29 March 2026 with stated annual capacity above 10,000 units. The line uses an industrial internet platform for digital management and quality traceability and is described as producing one robot every 30 minutes. That is evidence of a named facility and a stated production design. It is not evidence that the line will run at full capacity, that the output will be sold, or that every unit will meet the same industrial task requirement.
The comparison becomes clearer when industrial robots are used as a readiness proxy rather than a humanoid statistic. The International Federation of Robotics reported that China had about 2 million operational industrial robots and installed 295,000 industrial robots in 2024, equal to 54 percent of global industrial-robot installations that year. Its 2024 robot-density figures were 166 units per 10,000 manufacturing employees in China, compared with 449 in Germany, 446 in Japan, and 307 in the United States. These numbers describe conventional factory automation, not humanoid robots. Their value is different: they indicate where factories, integrators, maintenance skills, and automation customers already exist.
How China Got Here
China’s rise is not explained by a single subsidy or a single company. It is the result of an industrial system that links policy, hardware, factories, and application sites. The national standards report describes a six-pillar framework covering common foundations, computing, limbs and components, full-system integration, applications, safety, and ethics. That architecture treats humanoid robots as an industrial chain rather than only as a research project.
Policy is now pushing the sector from demonstration toward measurable work. A June 2026 notice from the Ministry of Industry and Information Technology and the State-owned Assets Supervision and Administration Commission calls for real-world training and application verification in industrial, service, and special-use settings. Its target is for key products to complete application verification and regular deployment in representative scenarios by the end of 2026, with more than 100 high-value application scenarios and the ability to support deployment at the 10,000-unit scale. Those are policy targets, not completed output. Their importance is that they define what the state considers proof: task success, efficiency improvement, safety, reliability, economic feasibility, data governance, and lifecycle responsibility.
The Foshan line illustrates the next step. A prototype becomes a production system only when its assembly sequence, inspection points, traceability, component supply, and service responsibilities can be repeated. The Shenzhen government has separately reported a pilot line for Leju Robotics’ Roban 2 research-and-education robot, with a stated annual output of 500 to 1,000 units and a certification path before mass production. Because that page identifies China Daily as its source and includes a commercial market estimate that is not used here, the safe conclusion is limited to the government-reported pilot and its stated process details.
Where Western and Japanese Players Still Lead
The production map is not a China-only story. The International Federation of Robotics reports that Germany and Japan have far higher industrial-robot density than China, while the United States also has a large installed base. That does not mean those countries lead in humanoid shipments. It means they retain deep pools of factory automation, process engineering, safety practice, and customer operations that can help a humanoid move from a demonstration into a controlled workflow.
BMW’s July 2026 disclosure makes the point visible. Its Landshut plant is developing software for artificial-intelligence-supported robotics in component production, including training-data processing, simulation, motion planning, and robot training. BMW says teams capture data from real production environments, test movement patterns in simulation, and then move from pilots toward staged scale-up. This is a different production advantage from a high-volume assembly line. It is the ability to turn factory knowledge into repeatable software and acceptance tests.
Japan’s strength is similarly better understood through the industrial system around a robot than through a humanoid brand list. Its 446 industrial robots per 10,000 manufacturing employees show a mature automation environment. For buyers, that can translate into experienced integrators, disciplined process control, and a workforce accustomed to measuring uptime and quality. It does not guarantee that a Japanese humanoid platform will be cheaper, more capable, or more available than a Chinese one. Those questions still require model-specific evidence.
The Technology Gap
The technology gap is not one gap. It is a stack of gaps that can appear at different points in the production map. The first is component depth. The State Council Information Office report identifies partial reliance on imported core components as a continuing bottleneck for China. The second is task generalization. A robot that repeats one pick-and-place sequence may still struggle when the object, lighting, fixture, or recovery condition changes.
The third gap is production reliability. The ministries’ 2026 notice calls for high-quality real-machine data, stronger adaptation to disturbances, longer-duration operation, thermal and fatigue design, power optimization, collision detection, force limits, emergency braking, and black-box functions. Those requirements explain why a production line’s headline capacity is not enough. A buyer needs the failure rate, intervention rate, maintenance interval, and acceptance test behind the capacity number.
The fourth gap is market access. The Federal Communications Commission says foreign-produced advanced robotic devices covered by its July 2026 update generally cannot receive United States equipment authorization for import, marketing, or sale unless the applicable approval path is met. The action is not simply a country scorecard, and its effect depends on the device definition, production status, and authorization route. In Europe, the European Commission says Regulation (EU) 2023/1230 will apply mandatorily from 20 January 2027. Production location therefore affects cost and supply, but it does not replace conformity assessment, safety documentation, or import planning.
What This Means for Buyers
For a general reader, the production map leads to a simple conclusion: the country that assembles the robot is only one part of the answer. A procurement team should ask where the key components are made, where the robot is tested, where the training data comes from, which factory has repeated the task, and who owns the recovery procedure when the robot fails.
A practical buyer checklist has five questions. What is the stated capacity, and what evidence shows actual throughput? Which components are locally controlled and which depend on external suppliers? Has the robot completed a measured task in a real workplace, or only a demonstration? Can the supplier provide safety, data-governance, service, and acceptance documentation for the destination country? Finally, can the buyer run a limited pilot with a clear exit path if reliability or economics do not meet the agreed threshold?
The new production map is therefore more useful than a country league table. China has built a broad and increasingly standardized manufacturing base, while Germany, Japan, the United States, and other advanced manufacturing economies retain deep automation, software, and process capabilities. The winning production system will be the one that connects scale with evidence, components with service, and policy ambition with a repeatable result on the factory floor.
This analysis synthesizes company statements, exchange filings, and public market activity; figures reflect disclosures available as of the information cut-off of August 17, 2026.
Disclaimer: This article is for general information purposes only and does not constitute investment, legal, or procurement advice. Readers should verify details with primary sources before making business decisions.