The 2026 Price Benchmark for Collaborative Robots
This pricing guide separates factory average selling prices from arm and software packages so buyers can compare collaborative robot quotations on a consistent basis. It uses disclosed Chinese manufacturer data and a 2026 UK public contract to establish a practical evidence ladder, while explaining why headline price gaps often overstate true brand differences.

Collaborative robot buyers face a pricing problem that is more fundamental than finding a quotation. The available figures often describe different things. A manufacturer filing may report the factory average selling price of a robot, while a public contract may cover an arm, software, accessories, and supplier support. The verified evidence reviewed for this benchmark spans from RMB8,200 for a Chinese four axis cobot category to £47,386 for a United Kingdom arm and software contract.[1] [3] Treating those observations as equivalent would create a false price gap. The useful benchmark is therefore not one headline number. It is a disciplined method for comparing like with like.
Price Range by Subcategory
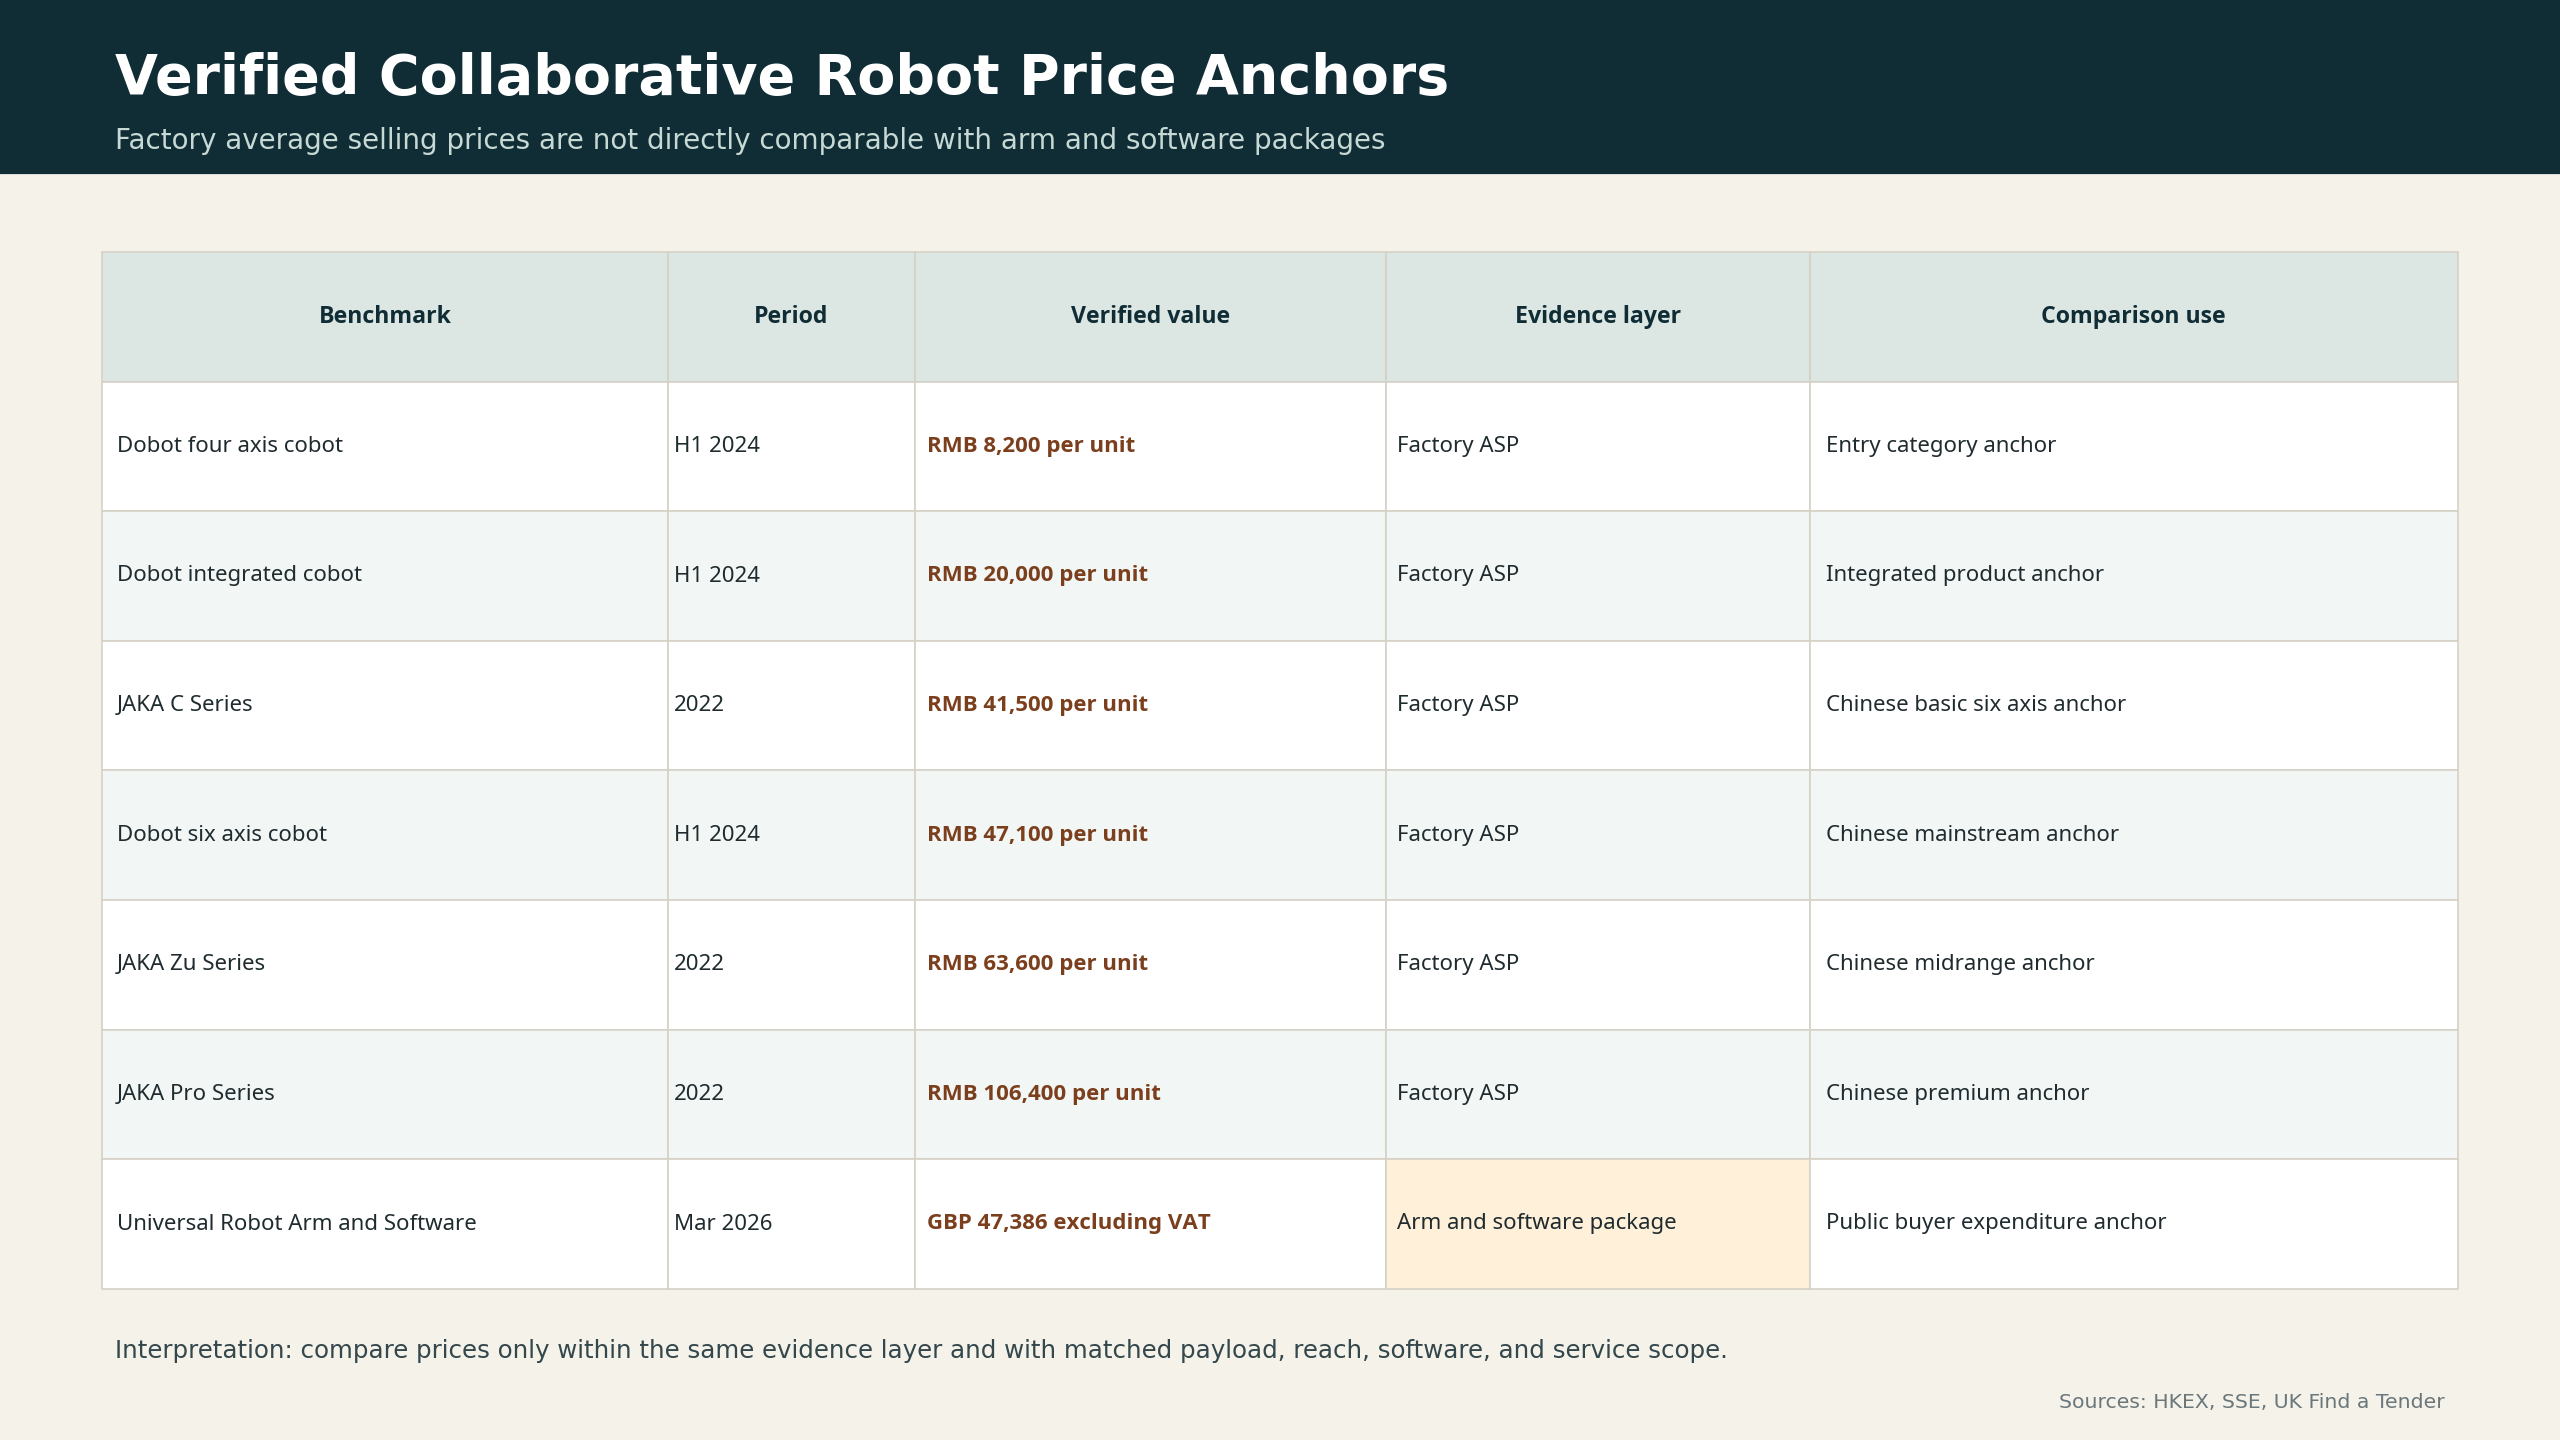
The strongest public Chinese pricing evidence comes from exchange filings because it reflects realised sales rather than advertised list prices. Shenzhen Dobot reported an average selling price of RMB8,200 per unit for four axis cobots in the first half of 2024. Its six axis cobots averaged RMB47,100, while integrated cobots averaged RMB20,000.[1] The counterintuitive position of integrated products below six axis arms shows why payload, product mix, and application must be checked before assigning a simple good, better, best hierarchy.
JAKA Robotics provides a second disclosed reference. In 2022, its C Series averaged RMB41,500 per unit, its Zu Series averaged RMB63,600, and its Pro Series averaged RMB106,400.[2] These older figures should not be presented as 2026 quotations. They are useful transaction anchors showing that a Chinese industrial cobot portfolio can span more than two times from a basic family to a premium family, even before integration.
A practical buyer range can therefore be organised into three categories. Entry products include compact four axis or education focused systems near the lower disclosed band. Mainstream Chinese six axis arms sit around the middle disclosed band. Higher performance Chinese arms and overseas packages occupy the upper end, but package scope becomes increasingly important. The latest official United Kingdom example is a £47,386 contract excluding value added tax for a Universal Robot Arm and Software, signed in March 2026.[3]
China vs Global Price Gap
At the Bank of England spot rate published for 14 July 2026, £1 equalled RMB9.0774.[4] Converting the United Kingdom contract at that rate produces an analytical equivalent of about RMB430,142. That is 9.1 times Dobot's first half 2024 six axis factory average of RMB47,100.[1] [3] [4]
The 9.1 multiple is not a defensible measure of Western brand premium. The Chinese figure is a manufacturer average across sold units. The United Kingdom figure is a single public procurement package that includes software and may include commercial support, although the notice does not itemise the scope. The model is also undisclosed. The comparison is still valuable because it quantifies how far a buyer can drift when one quotation is read as an arm price and another as a package price.
The original analytical rule for procurement teams is simple: classify every observation before comparing it. Layer one is factory average selling price. Layer two is an arm and software package. Layer three is the commissioned cell, including tooling, guarding where required, engineering, and acceptance testing. China versus global comparisons are meaningful only within the same layer and for similar payload, reach, protection rating, and application requirements.
What Drives the Price
Hardware architecture establishes the first cost floor. Dobot's listing prospectus describes the cost structure of a representative five kilogram six axis cobot as 34 percent gear reducers, 23 percent motion controllers, 18 percent servo systems, 10 percent sensors, and 15 percent other components.[1] Payload and reach can increase the specification of several of those components at once, which explains why a higher capacity model is not merely a larger version of the same product.
Commercial scope creates the second cost layer. Software options, end effectors, vision, mounting, safety assessment, application programming, and commissioning can change the usable capability of an identical arm. Certification and local support also affect the delivered price because the supplier is assuming responsibility for documentation, training, warranty response, and deployment risk. Buyers should therefore request a quotation that separates the arm, controller, software, accessories, engineering, training, warranty, and freight. A low arm price can still produce an expensive cell if those items are added later.
Price Trend
Chinese disclosed prices show selective compression rather than a universal decline. Dobot's six axis average selling price fell from RMB65,900 in 2021 to RMB47,100 in the first half of 2024, a calculated reduction of 28.5 percent. Its four axis average was RMB8,200 in both periods.[1] JAKA's 2021 to 2022 averages were broadly stable within each product family, with the Zu Series moving from RMB63,200 to RMB63,600 and the Pro Series from RMB105,700 to RMB106,400.[2]
The evidence suggests that localisation, production scale, and product mix can compress the mainstream six axis category while mature entry products retain a harder price floor. Later filings do not justify extending that decline mechanically into 2026. Dobot reported that six axis cobot revenue rose 44.7 percent in 2025, but it did not disclose a current average selling price.[5] Teradyne reported that Robotics revenue fell 15.5 percent in 2025, driven by lower sales of collaborative arms and mobile robots, but it also did not disclose unit prices.[6] Revenue direction is not a substitute for pricing evidence.
Benchmark Reference
The benchmark table uses an evidence confidence ladder rather than blending every observation into one average. Filing based factory averages receive the strongest comparability score for manufacturer economics. Public contracts receive a strong score for buyer expenditure, but only after scope is tagged. Unitemised distributor quotes and marketing prices should not enter a benchmark until the included hardware, software, services, tax treatment, and delivery terms are known.
This approach matters as adoption broadens. The International Federation of Robotics recorded 542,000 factory robot installations in 2024 and reported double digit growth for collaborative robot installations.[7] More volume will create more price observations, but quantity alone will not make them comparable. The investable signal is the gap between a falling standardised arm cost and the value retained in software, integration, support, and application knowledge. A credible 2026 cobot benchmark must track both sides of that equation.
References
[1] Shenzhen Dobot Corp Ltd, Global Offering Prospectus, 13 December 2024
[2] JAKA Robotics, Shanghai Stock Exchange Draft Prospectus, 9 May 2023
[4] Bank of England Database, Daily Spot Exchange Rates Against Sterling
[5] Shenzhen Dobot Corp Ltd, Annual Results for the Year Ended 31 December 2025
[6] Teradyne Inc, Form 10 K for the Year Ended 31 December 2025
[7] International Federation of Robotics, World Robotics 2025 Press Conference Presentation