Total Cost of Ownership: The Real Price of a Collaborative Robot
A complete financial picture of cobot ownership beyond the invoice, with all prices explicitly denominated (USD model; RMB and GBP anchors): integration and safety validation under ISO 10218-2:2025, training and wage time, maintenance and spare parts, downtime exposure, depreciation and end-of-life economics, assembled into an original three-scenario five-year total cost of ownership model showing why the sticker price is a minority of the real cost, set against the WAIC 2026 procurement wave.

A collaborative robot arm that invoices at USD 35,000 can consume between roughly two and five times that amount over its first five years of service, depending on how it is deployed. That multiple is not a markup or a hidden fee. It is the sum of integration engineering, safety validation, training, spare parts, energy, and downtime exposure, and it varies more between deployments of the same arm than between competing arms. The previous article in this series closed with a warning that the factory average selling price, the arm and software package, and the commissioned cell are three different financial objects: a leading Chinese manufacturer's prospectus discloses a factory average selling price of RMB 47,100, roughly USD 6,600, for a six axis cobot in the first half of 2024, while a March 2026 UK public contract for a single arm and software package closed at GBP 47,386, roughly USD 60,000, and neither figure describes a commissioned cell. 1 2 This article completes that argument with the full five year picture, denominated in US dollars throughout, using verified public figures where they exist and clearly labelled illustrative assumptions where they do not, so that a buyer can build a defensible total cost of ownership estimate before signing a purchase order.
The timing of this analysis is deliberate. The World Artificial Intelligence Conference closed in Shanghai on 20 July 2026 with organisers reporting roughly RMB 20.4 billion, approximately USD 2.8 billion, in intended procurement across 212 published purchasing demands, alongside 351 global-first product launches. 11 Almost all of the pricing headlines that emerged from the conference concerned humanoid robots rather than collaborative arms, and no verifiable cobot list price change was announced by any manufacturer against a primary source. The procurement wave is nonetheless a live reminder of the question this article answers: as buying activity accelerates, the discipline that separates a good automation investment from an expensive lesson is a clear-eyed model of what the machine costs after the invoice is paid.
Installation and Integration Costs
The largest cost surprise in most first deployments is not the robot. It is the engineering that surrounds it. A long-standing rule of thumb from the integrator community holds that in a fully integrated turnkey system the robot itself is often only about one third of the total installation cost, once design, tooling, safety guarding, conveyors, integration services, programming, and installation are counted. 3 That estimate dates from the era of caged industrial robots, and cobots were designed specifically to compress it. Hand guiding and tablet based programming reduce the need for specialist robotics engineers, and a cobot cell that passes its risk assessment without physical fencing avoids an entire category of guarding hardware and floor work. 4 Even so, compression is not elimination. The end effector, part presentation, electrical work, and software integration with existing machines remain real line items in every deployment.
The 2025 revision of the governing safety standards added a further structural cost that buyers should plan for rather than discover. ISO 10218-2:2025 places the safety obligations of the integrated application, including design, integration, commissioning, operation, maintenance, and decommissioning, at the level of the cell rather than the arm. 5 The risk assessment and validation of a collaborative application is therefore a mandatory engineering activity in every deployment, whether performed by an external integrator or by trained internal staff. A realistic integration budget for a simple, self-integrated cobot cell can approach half the arm price, while a complex application with custom tooling and machine interfaces can exceed the arm price by a comfortable margin. The scenario model at the end of this article treats integration as a band rather than a point for exactly this reason.
Training and Onboarding
Training is the cheapest major line in the cobot budget and the one with the highest return, because it determines whether the plant can retask the arm without paying an integrator each time. Cobot vendors have invested heavily in accessible programming precisely to shift this capability in-house, and the International Federation of Robotics identifies easy programming through hand guiding and tablet interfaces as a defining feature of the category. 4 The cash cost of formal operator and maintenance training is usually modest. The larger, less visible cost is wage time. The US Bureau of Labor Statistics reports a median wage of USD 30.53 per hour for industrial machinery mechanics, machinery maintenance workers, and millwrights as of May 2024, and a first deployment realistically absorbs several working weeks of combined operator and technician time across training, trial runs, and program refinement. 6
Buyers should also treat training as a hedge against a tightening labour market. The BLS projects employment of industrial machinery mechanics and related maintenance occupations to grow 13 percent between 2024 and 2034, much faster than the average occupation, which signals rising competition and rising wages for exactly the people who keep automated cells running. 6 A plant that trains two or three internal staff on the cobot platform reduces both its integrator dependence and its exposure to that labour market.
Maintenance and Spare Parts
Cobots carry a genuinely lighter maintenance profile than caged industrial robots, but lighter does not mean free. The integrator scenario published by the US robotics association for a conventional industrial robot budgets a few hundred US dollars per year of preventive maintenance in the early years, a larger wear-item replacement, mainly internal wire harnesses, after roughly the fourth year, and a refurbishment costing around half the robot's asset value after eight to ten years or roughly 30,000 operating hours. 3 Cobot joints are built around the same fundamental components, and the cost structure disclosed in a listed manufacturer's prospectus shows why wear matters financially: gear reducers alone account for 34 percent of the material cost of a representative six axis cobot, with motion controllers at 23 percent and servo systems at 18 percent. 1 When a joint reducer or harness reaches end of life, the buyer is replacing the most expensive things in the arm.
The practical planning consequence is a small but real annual budget and a deliberate spares strategy. A buyer should ask the supplier for the documented maintenance schedule, the price list for the top five wear parts, the location of the nearest spare parts stock, and the guaranteed turnaround for a joint replacement, then hold a modest spares inventory for anything with a lead time longer than the plant can tolerate. These questions belong in the sourcing conversation described in the previous article, because after-sales economics are set at contract time, not at failure time.
Downtime and Productivity Risk
Downtime is where a cheap cell becomes expensive. Published, verifiable benchmarks for cobot-specific mean time between failures do not exist as a public dataset, and generic downtime cost figures circulating online vary so widely that this article deliberately treats downtime as a scenario input rather than an asserted fact. The logic, however, is straightforward. The cost of an hour of unplanned stoppage equals the margin on the output lost, plus any contractual penalties, plus the labour idled around the cell. For a cobot tending a single machine on a two-shift pattern, that figure may be a few hundred US dollars per hour. For a cell feeding a synchronised line, it can be orders of magnitude higher. The buyer, not the vendor, holds the information needed to compute it, and computing it before purchase changes sourcing behaviour in healthy ways: it justifies service contracts with guaranteed response times, local spares, and redundancy planning that look expensive until they are compared with a single day of lost production.
Supplier stability belongs in the same risk register, because a robot is only as serviceable as the company behind it. The series has already noted that the robotics segment of Teradyne, owner of the largest Western cobot brand, reported revenue of USD 91 million in the first quarter of 2026 after a difficult 2025, and that buyers should read segment disclosures before committing a production line to a five year support relationship. 7 A financially stressed supplier does not fail loudly; it fails through slower parts, thinner support coverage, and discontinued product lines, all of which surface as downtime on the buyer's floor.
End of Life and Upgrade Costs
The end of the cobot's financial life rarely coincides with the end of its mechanical life. For tax purposes, manufacturing machinery in the United States generally falls into a seven year depreciation class, which means the book value of a cobot bought today is written down over a period longer than the five year window most procurement teams model. 8 Mechanically, a well maintained arm can run beyond a decade with refurbishment, and the refurbishment decision, typically priced around half the asset value for conventional robots, is effectively a second, smaller purchase decision that arrives around year eight to ten. 3
Cobots hold one structural advantage at this stage of the lifecycle: redeployability. Because the arm is not welded into a fenced, application-specific cell, a cobot that finishes its first assignment can be reprogrammed and moved to a second station at a fraction of the original integration cost, extending its earning life without new capital. A visible secondary market for used cobot arms reinforces residual value, although resale prices vary widely with condition, hours, and generation, so this model conservatively assumes a modest residual rather than quoting an unverifiable market figure. The genuine end-of-life cost to plan for is generational: as controllers, software platforms, and safety standards move, an older arm gradually loses compatibility with new peripherals and new compliance documentation, and the 2025 standards revision is a live example of how a regulatory cycle can age an installed base. 5
Total Cost of Ownership ("TCO") Summary
The table below assembles these threads into an illustrative five year model for a single mid-payload six axis cobot cell in a machine tending application, operated on two shifts of roughly 4,000 hours per year in a US plant, with all figures in US dollars. The method is a three scenario build-up: a lean case with self-integration and no major incident, a base case with mixed internal and external integration, and a heavy case with full external integration and a material downtime event. Verified public figures anchor the energy and wage lines: a mid-payload cobot draws approximately 350 watts under a typical program, which at the December 2025 US industrial average electricity price of 8.53 US cents per kilowatt-hour amounts to roughly USD 120 per year, and technician time is costed at the BLS median wage. 9 10 6 All other lines are stated assumptions, not measurements, and the model's limitation is precisely that integration, downtime, and residual values are deployment specific. The purpose is not to predict a buyer's exact cost but to show its structure and its sensitivity.
Illustrative Five-Year TCO: One Mid-Payload Cobot Cell vs Sticker Price (all figures in USD)
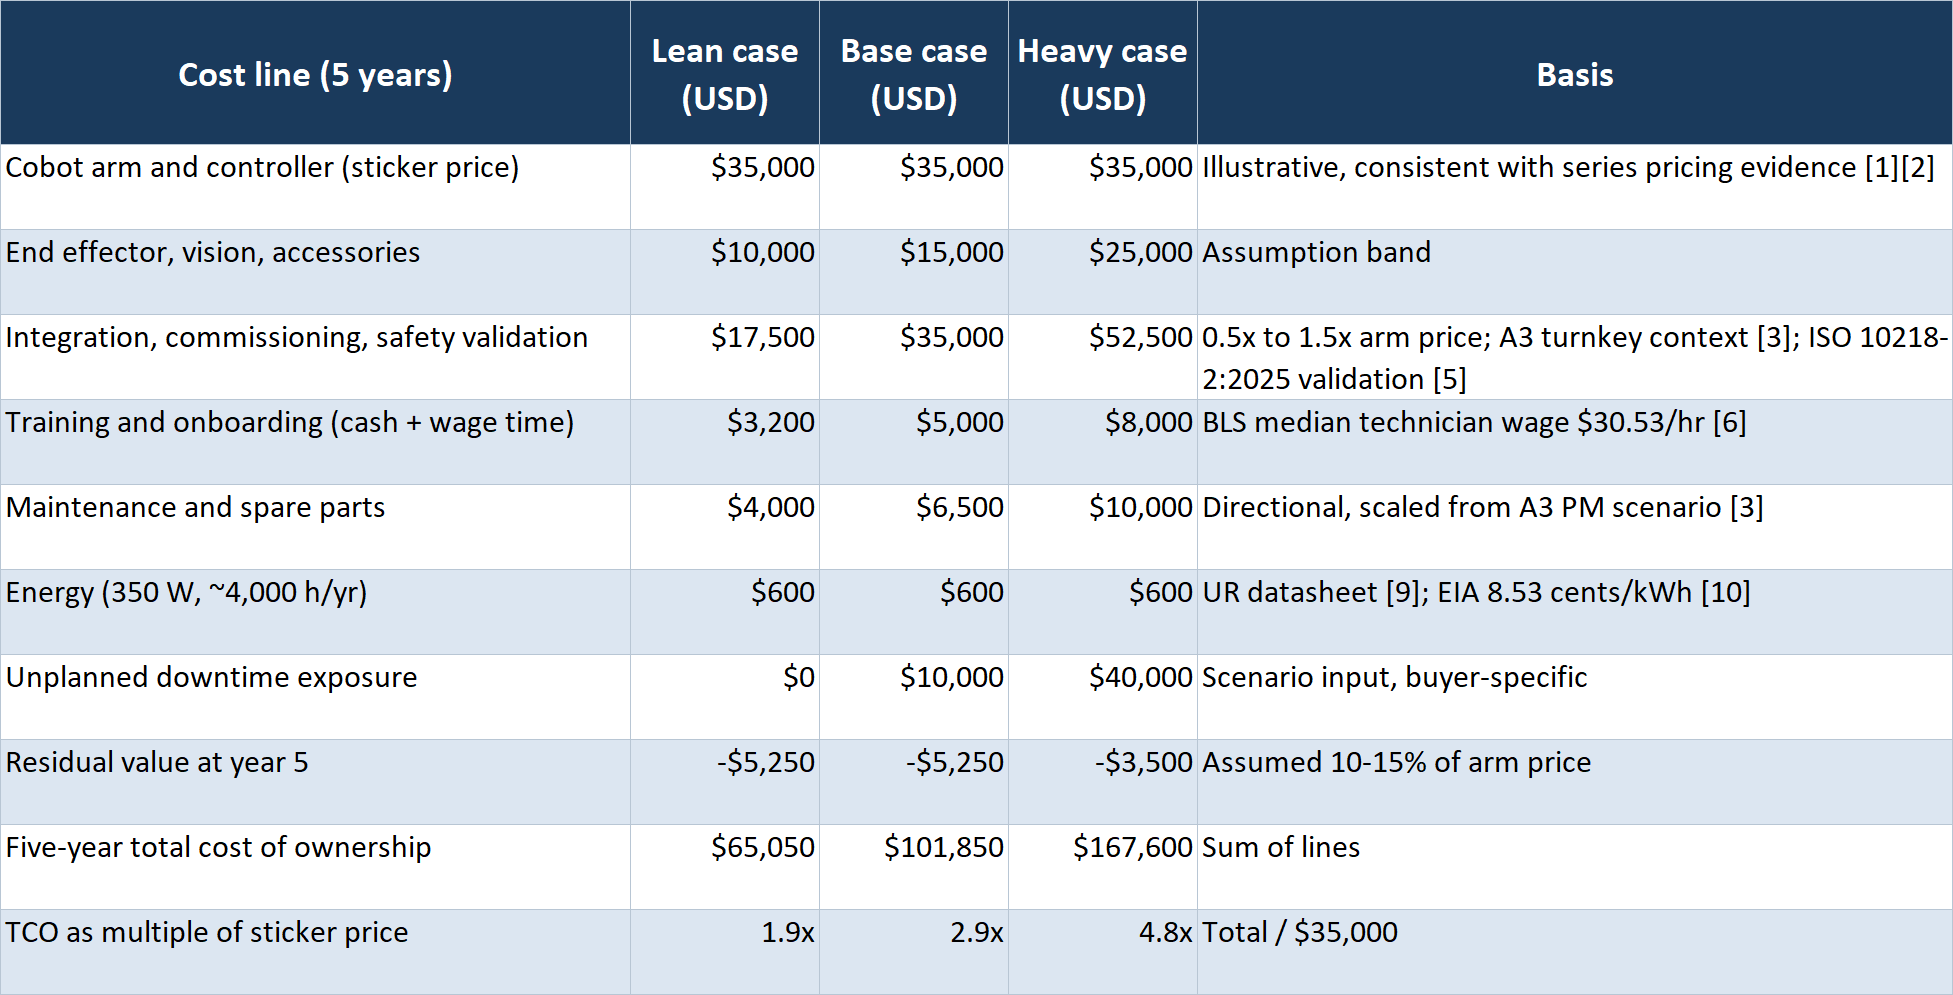
All values in US dollars (USD). Illustrative model, US machine-tending deployment, two shifts (~4,000 h/yr). Verified anchors: energy and wage lines. Integration, downtime and residual lines are stated assumptions. Sources: Dobot HKEX prospectus (2024, RMB); UK Contracts Finder (2026, GBP); A3 (2015); ISO 10218-2:2025; US BLS (May 2024); UR datasheet; US EIA (Dec 2025).
Three conclusions survive any reasonable change to the assumptions. First, the sticker price is a minority of the five year total in every scenario, ranging from a little over half in the lean case to barely a fifth in the heavy case. Second, energy is financially irrelevant next to integration and downtime; a full year of two-shift operation costs less than a single hour of technician time. Third, the spread between the lean and heavy scenarios is wider than the price gap between competing arms, which means the buyer's own deployment choices, in-house capability, service contracts, and downtime preparedness, move the real price of a collaborative robot more than the brand on the invoice does.
The Hidden Cost Map: Where Cobot Money Actually Goes
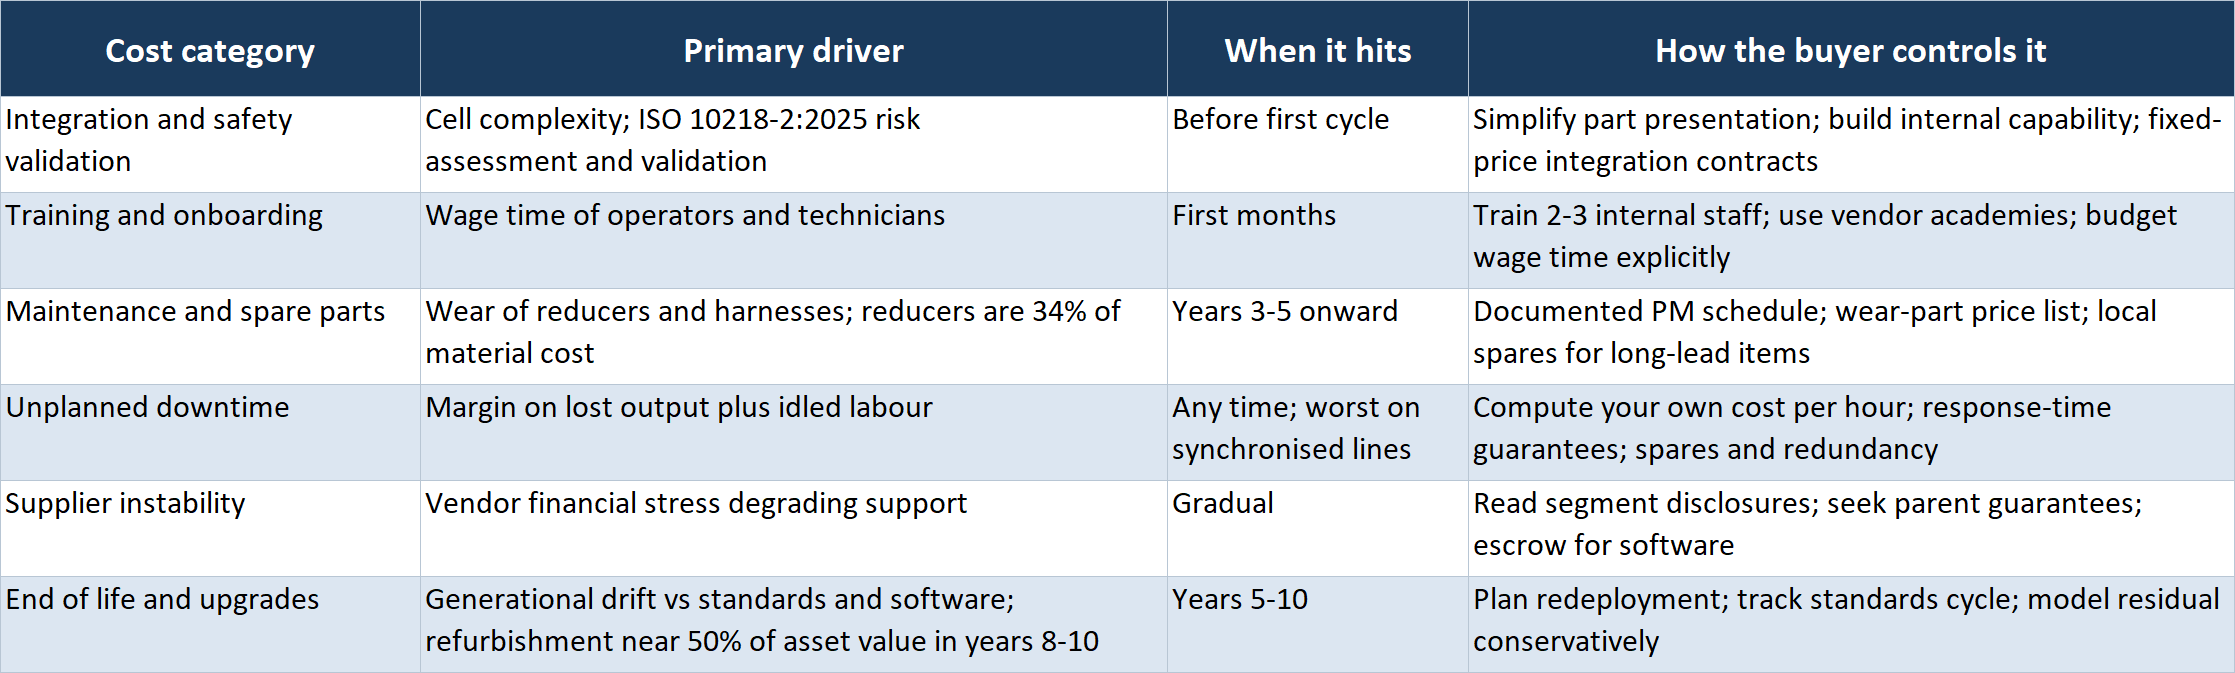
Synthesis of evidence reviewed for this series. Component cost shares: Dobot HKEX prospectus (2024). Maintenance and refurbishment pattern: A3 integrator scenario (2015), directional for cobots.
The procurement lesson of this series compounds one article at a time. The price benchmark showed what the arm costs, the buyer's guide showed how to source it on evidence, and this model shows what owning it actually costs. The final article in the cobot series turns from cost to capital and asks why investors are betting on this asset class at all.
References:
1. Shenzhen Dobot Corp Ltd, Global Offering Prospectus, 13 December 2024.
2. UK Contracts Finder, Universal Robot Arm and Software contract award, March 2026.
5. International Organization for Standardization, ISO 10218-2:2025.
7. Teradyne Inc, Teradyne Reports First Quarter 2026 Results, 28 April 2026.
8. US Internal Revenue Service, Publication 946: How To Depreciate Property (2025).
9. Universal Robots, UR10e Technical Datasheet (power consumption specification).
Disclaimer
The information provided in this article is for informational purposes only and should not be construed as financial, investment, tax, or strategic advice. The five year total cost of ownership model is illustrative and denominated in US dollars (USD): verified public figures anchor the energy and wage lines, while integration, downtime, and residual value lines are stated assumptions that vary by deployment. Prices quoted from sources retain their original currencies (RMB, GBP, USD) with approximate USD equivalents at prevailing exchange rates for orientation only. Figures reflect the disclosure scopes and reporting periods stated in the cited sources. Information cut-off: 23 July 2026, including the WAIC 2026 post-conference scan.