Beyond the Invoice: Calculating the True Cost of an AMR and AGV
In the first half of 2026 a listed intralogistics group earned more from servicing its installed fleet than from selling new machines, while North American robot order value per unit declined. Equipment pricing is under pressure and the service annuity is not, which means the buyer who negotiates hardest on the invoice is contesting the part of the relationship the vendor most willingly concedes. Post 9 of our AMR and AGV series introduces the ARPI Cost Certainty Ladder, which classifies each lifetime cost line not by size but by how its number becomes knowable, from contracted through quoted, derivable and contingent to genuinely unknowable. Applying it reorders the negotiation: derivable lines should be calculated rather than requested, and contingent and unknowable lines require contract structure rather than a better forecast. The article declines to publish a downtime cost per hour, a maintenance percentage or a battery replacement figure, because twenty-seven candidate sources for those numbers proved inadmissible, and it explains what to require instead.
On 30 July 2026 KION Group published its interim report for the first half of the year. Inside it sits a number that should reframe how any buyer approaches an automation purchase. In the group's Industrial Trucks and Services segment, revenue from servicing the installed fleet reached 2,099.6 million euro. Revenue from selling new machines reached 1,972.9 million euro. Service was the larger business. It also grew, by 0.8 percent, while new business contracted by 3.4 percent. Across the group as a whole, service accounted for 47.4 percent of all revenue.
Read that alongside the order data published by the Association for Advancing Automation for the first quarter of 2026. North American companies ordered 9,055 robots, down 0.1 percent on the same quarter a year earlier. The value of those orders was 543 million United States dollars, down 6.4 percent. Units held. Revenue per unit did not.
Put the two together and the commercial position becomes clear. Equipment pricing is under sustained pressure. The service annuity is not. A buyer who spends their negotiating capital on the invoice is contesting the part of the relationship the vendor is most willing to concede, and leaving untouched the part the vendor's own accounts show to be larger, steadier and more profitable. The invoice is the entry ticket. The revenue comes later, and it comes from you.
This is the fourth article in this week's examination of autonomous mobile robots, known as AMRs, and automated guided vehicles, known as AGVs. It addresses the question that determines whether an automation programme creates value or quietly destroys it. Not what the machine costs. What owning it costs.
There is a difficulty to confront at the outset, and confronting it honestly is more useful than pretending it away. In preparing this analysis we examined and rejected twenty-seven sources. Every one of them offered exactly the figures a cost article is expected to contain: maintenance as a percentage of purchase price, downtime cost per hour, battery replacement cost, mean time between failures. Not one of those figures traced to an accountable primary source. The most widely circulated downtime figure in industrial automation, 260,000 United States dollars per hour, is attributed across dozens of vendor pages to a research firm whose original study names no year, no sample and no methodology, and which none of the citing pages links to. The published academic literature on mobile robot reliability reports mean time between failures ranging from seven hours to 936 hours, a spread of more than a hundredfold, and most of it concerns field and rescue robots rather than warehouse vehicles.
So the buyer's problem is not the absence of a total cost number. Numbers are abundant. The problem is that the buyer has no way to distinguish a figure that is contractually binding from one that was invented to fill a cell in a spreadsheet, and both arrive formatted identically in the same business case. What follows is therefore built to hand you instruments rather than answers.
Installation and Integration Costs
The cost of putting a mobile robot to work begins with an obligation most buyers do not know they have accepted. ISO 3691-4, the international safety standard for driverless industrial trucks, places requirements in its Annex A on the preparation of the operating zone. The vehicle standard governs the vehicle. The building is the buyer's responsibility, and the standard says so.
That obligation converts directly into capital expenditure that appears on no vehicle quotation. Floor surfaces must meet flatness and traction requirements the robot's drive and navigation systems assume. Aisle widths must accommodate the vehicle's swept path plus its safety margins, which is frequently a larger envelope than the vehicle's physical dimensions imply. Lighting must suit the sensing modality. Charging positions require electrical provision at the right capacity in the right location, and the right location is determined by traffic modelling that has usually not been done at the point the vehicle is quoted. Where the vehicle interacts with fixed equipment, conveyors, lifts, doors or racking, each interface is an integration project with its own scope, its own testing and its own failure modes.
The standard is also explicit about what it does not cover. Power sources are outside its scope. So are freezer and extreme climate applications, strong magnetic fields, public zones, explosive atmospheres and several other conditions. Each exclusion marks a place where the buyer's site conditions may impose engineering the standard does not contemplate and the vendor has not priced.
The commercially important characteristic of this cost category is not its size. It is its behaviour. Installation and commissioning are quoted as fixed-scope line items and delivered as variable ones, because the quotation is prepared from drawings and the work is executed in a building that differs from its drawings. Every experienced automation buyer has a story about a floor that needed levelling, a ceiling height that changed the sensor configuration, or a legacy conveyor whose control interface was not what its documentation claimed. These are not exceptional events. They are the normal condition of retrofitting automation into working facilities.
A second characteristic matters more for a fleet than for a single machine. Integration cost does not scale linearly with vehicle count. The first vehicle carries the whole burden of traffic design, interface engineering, safety validation and operator procedure. The tenth vehicle carries very little of it. This means the cost per vehicle of a small pilot is dramatically worse than the cost per vehicle of a production fleet, and a pilot evaluated on cost per vehicle will therefore misinform the decision it was commissioned to inform. Pilots should be evaluated on whether they resolve uncertainty, not on their unit economics.
Training and Onboarding
Training is the cost line most often reduced to a course fee, and the course fee is the least significant part of it. The real cost is the productive time withdrawn from the operation, and unlike most lines in this analysis it can be calculated rather than guessed.
The United States Bureau of Labor Statistics reports average hourly earnings in the warehousing and storage subsector at 26.76 United States dollars in May 2026, on a preliminary basis, against 26.78 dollars in April and 26.65 dollars in March. Production and non-supervisory employees in the same subsector earned 25.97 dollars in April. These are earnings, not fully loaded employer cost. Benefits, payroll taxes and overhead sit on top, so the figure is a floor for any calculation rather than an answer. It is also United States data, and a buyer in Guangdong, Guadalajara or Gdansk must substitute their own.
With a rate in hand, training becomes arithmetic. Multiply the loaded hourly cost by the number of people to be trained, by the hours each is withdrawn, by the number of times this recurs. That last multiplier is the one buyers omit. Training is not an event. Warehouse labour turnover means the operator cohort trained at commissioning is not the cohort operating the fleet eighteen months later, and every new hire requires the same induction. A training cost modelled as a one-off understates the real figure by whatever the turnover rate implies over the ownership term.
Two populations need training, and they are not interchangeable. Operators need to understand normal interaction, exception handling and the boundary between a situation they may resolve and one they must escalate. Maintenance and technical staff need substantially deeper capability, and they cost more per hour. The Bureau's occupational data for the same industry shows a wide spread between material handling occupations and technical ones, which is unsurprising but has a consequence: a buyer who plans to maintain the fleet in-house is committing to develop and retain a scarcer, more expensive skill set, and to keep developing it as the fleet's software changes.
There is also a continuing obligation that most buyers do not recognise as a training cost at all. The ANSI and A3 R15.08 standard family divides responsibility across three parts. Part 1 binds the manufacturer of the industrial mobile robot. Part 2 binds the integrator who builds the system. Part 3, published in 2026, binds the operating company, which is to say the buyer. It addresses the use of industrial mobile robot applications, and its obligations are continuing rather than one-off: procedures, competence and change control persist for as long as the fleet operates. Every material change to the fleet, its route network or its task set potentially triggers reverification and retraining. This is a permanent operating cost created by a standard, and it does not appear on any quotation.
Maintenance and Spare Parts
The conventional way to present maintenance cost is as an annual percentage of purchase price. We are not going to do that, because no admissible source publishes such a percentage for this asset class, and a fabricated percentage compounded over five years produces an authoritative-looking total built on nothing.
What can be established is more useful. Return to the KION disclosure. In the segment where that group sells and services warehouse trucks, servicing the installed base generated more revenue than selling new machines, and it did so while new machine revenue fell. On the group's own earnings call, management attributed service growth of 12 percent particularly to modernisation and upgrade work. Across the whole group, service was 47.4 percent of revenue.
The precise ratio belongs to KION and to an equipment mix dominated by forklifts and warehouse trucks rather than autonomous vehicles, and it should not be transplanted onto an AMR or AGV purchase as a percentage. But the structural fact travels. In intralogistics equipment, the aftermarket is not a tail. It is approximately half the business. When a vendor prices a machine keenly, they are not being generous. They are buying an annuity, and the annuity is paid by the buyer over the life of the asset.
For a mobile robot specifically, the maintenance cost stack has a shape that differs from stationary equipment in three ways that buyers routinely underestimate.
The first is the battery. ISO 3691-4 explicitly excludes power sources from its scope, which means battery safety and lifecycle are governed elsewhere, principally by the ANSI, CAN and UL 3100 standard for automated mobile platforms. That standard addresses battery management systems and thermal runaway mitigation, and it contemplates fire risk to the point of requiring that a fire be contained within the product until it can be extinguished. The commercial reading of that architecture is straightforward: the battery is not part of the vehicle's safety case, it is a separate system with its own standard, and its replacement is the buyer's problem.
Battery replacement cost can be calculated, though not quoted. The method is capacity in kilowatt hours, multiplied by the pack price per kilowatt hour in your region, multiplied by the number of replacements the ownership term requires. Two of those three inputs are available. Pack prices vary sharply by geography and chemistry, with blended global pricing around 108 United States dollars per kilowatt hour, lithium iron phosphate cells materially below that, Chinese packs near 84 dollars, North American packs running roughly 44 percent above Chinese levels and European packs roughly 56 percent above. The third input, capacity, must come from your specification sheet, because the AMR and AGV category spans vehicles whose packs differ by more than an order of magnitude and no representative figure exists. The consequence is worth stating plainly: the same vehicle carries a materially different battery replacement bill in Michigan than in Guangdong, and the chemistry chosen at specification determines that exposure years before the invoice arrives.
The second is the sensor suite. Lidar unit costs have fallen dramatically, from eighty to a hundred thousand United States dollars per mechanical unit in the middle of the last decade to roughly ten to twenty thousand dollars today, with suppliers targeting solid-state units below five hundred and in some cases below two hundred dollars. Those low figures are targets rather than achieved prices, and solid-state units typically cover 180 degrees or less, so matching a spinning unit's coverage can require three or four of them. For maintenance planning this means the replacement cost of a damaged sensor is falling but the number of sensors per vehicle may be rising, and a fleet's spare parts inventory must be sized against the sensor architecture rather than against the sensor price.
The third is that spare parts pricing is not fixed at purchase. A part imported in year four is exposed to the duty regime in force in year four, not the one in force when the vehicle was bought. That regime is currently unstable. United States Section 232 measures impose 25 percent on semiconductors, with drawback not permitted, and duties on steel, aluminium and copper derivatives that reach 50 percent on certain classifications and are applied to the full value of the good rather than the value of the metal content. A Section 122 global surcharge of 10 percent stacks on top. The Court of International Trade declared the underlying proclamation invalid on 7 May 2026, but collection was not enjoined, no refunds were ordered, and the government has appealed. No tariff line targets mobile robots directly, so the exposure is indirect, arriving through components and subassemblies. But a buyer signing a five-year spare parts price list denominated in a currency and a duty regime that may not survive the term is accepting a risk they have probably not priced.
Downtime and Productivity Risk
This is the section where a conventional cost article states a figure, and it is the section where we decline to.
The framework for this series asks for mean time between failures and mean time to repair benchmarks where available. They are not available for warehouse mobile robots in any admissible, current and representative form. The peer-reviewed literature that exists reports mean time between failures of around eight hours with availability below 50 percent in one widely cited study of field and rescue robots, and a range from 138.7 hours to 936 hours in a single industrial case study that also reports roughly seven hours for some units within the same population. A spread of more than a hundredfold inside the published literature is not a benchmark. It is evidence that reliability in this asset class is dominated by application and environment rather than being an attribute of the machine.
The same conclusion arrives from the research frontier. A peer-reviewed paper published on 3 August 2026 in The International Journal of Advanced Manufacturing Technology proposes a confidence-aware, multi-fidelity digital twin framework for time-critical, incident-driven fleet management of autonomous mobile robots. That such a framework is a current research contribution tells you that predicting and responding to fleet incidents remains an open problem in 2026. Fleet disruption is a system-level property arising from traffic interaction, exception handling and human intervention, not a per-vehicle reliability statistic.
This has a direct procurement implication. Any single mean time between failures figure a vendor quotes is unfalsifiable unless it arrives with the duty cycle, the environment, the payload profile, the definition of failure and the observation period that produced it. Without those, it is not a specification. It is a marketing number with a unit attached.
The buyer's protection is therefore not a reliability figure at all. It is a measured availability commitment, defined in your building, on your duty cycle, with your definition of what counts as unavailable, and with a consequence attached when it is missed. That converts an unknowable cost into a contracted one, which is the only useful move available.
As for the cost of downtime itself, calculate your own. You know your throughput per hour, your margin per unit and your ability to recover lost volume in the same shift. Those three inputs give you a defensible figure specific to your operation. A number sourced from a vendor's business case, however confidently presented, tells you about the vendor's sales process rather than about your facility.
End of Life and Upgrade Costs
The end of an asset's life is the most poorly modelled part of most automation business cases, for the straightforward reason that it is furthest away and least verifiable at the moment of signature.
Begin with the distinction that causes the most confusion. An asset's tax recovery period and its economic useful life are different numbers, set by different authorities for different purposes. A depreciation schedule tells you how quickly you may recognise the cost against taxable income. It tells you nothing about how long the vehicle will remain fit for its task, and nothing about what it will be worth when it is not. Buyers who set their model horizon to the depreciation schedule have chosen an accounting convention as an engineering assumption.
Economic life for a mobile robot is not determined by mechanical wear. It is determined by software. VDA 5050, the interface standard governing communication between mobile robots and fleet management systems, has reached version 3.0.0. Major version increments carry breaking changes by definition. A fleet that cannot move to the current interface version becomes progressively harder to extend, integrate and support, and the cost of that migration is a genuine upgrade cost that no purchase model captures. The vendor's own commercial behaviour confirms the pattern: KION attributed part of its service growth specifically to modernisation and upgrade work, which is to say that upgrading the installed base is a recognised, growing revenue line rather than an occasional courtesy.
Residual value deserves particular scepticism. There is no liquid secondary market for autonomous mobile robot fleets, no published price index, and no standard condition grading. A vehicle whose fleet software is a major version behind, whose battery is at the end of its cycle life, and whose safety validation was performed for a specific operating zone in a specific building is not a portable asset. It is a machine with a highly local value. Any residual value assumption in a business case should therefore be treated as a rung on the least certain part of the ladder, and a prudent model tests the case at a residual value of zero to see whether the decision survives.
Two structural options change this picture materially and deserve consideration before signature rather than after. The first is contractual: negotiate upgrade rights and interface-version support commitments at the point of purchase, when the vendor is competing for the order, rather than in year four when the switching cost is sunk and the negotiating position has inverted. The second is commercial, and is the most useful single instrument in this article.
Robotics-as-a-service contracts price hardware, software and maintenance as a recurring fee. Under such a structure the vendor absorbs battery replacement, spare parts, maintenance, obsolescence and residual risk. That fee is therefore the vendor's own estimate of the total cost of ownership, plus margin, plus a premium for the risks the vendor also cannot forecast. It follows that a buyer who obtains both a purchase quotation and a service quotation for the same machine over the same term has been handed the vendor's internal view of lifetime cost. Annualise the difference and you have the vendor's answer to the question you are trying to answer, disclosed without being volunteered. It costs nothing to ask for both.
Total Cost of Ownership Summary
The table accompanying this section presents a five-year cost stack for a mobile robot deployment, normalised so that the purchase price equals 100. It contains no absolute currency figures, and that is deliberate. This asset class spans tote carriers and multi-tonne pallet movers whose invoices differ by an order of magnitude, and every absolute five-year figure encountered in preparing this analysis came from a source we would not cite. Normalisation makes the model checkable, portable across currencies and immune to the objection that the base price is wrong. Multiply by your own invoice.
Table 1: The Five-Year Cost Disclosure Test, normalised to a purchase price of 100
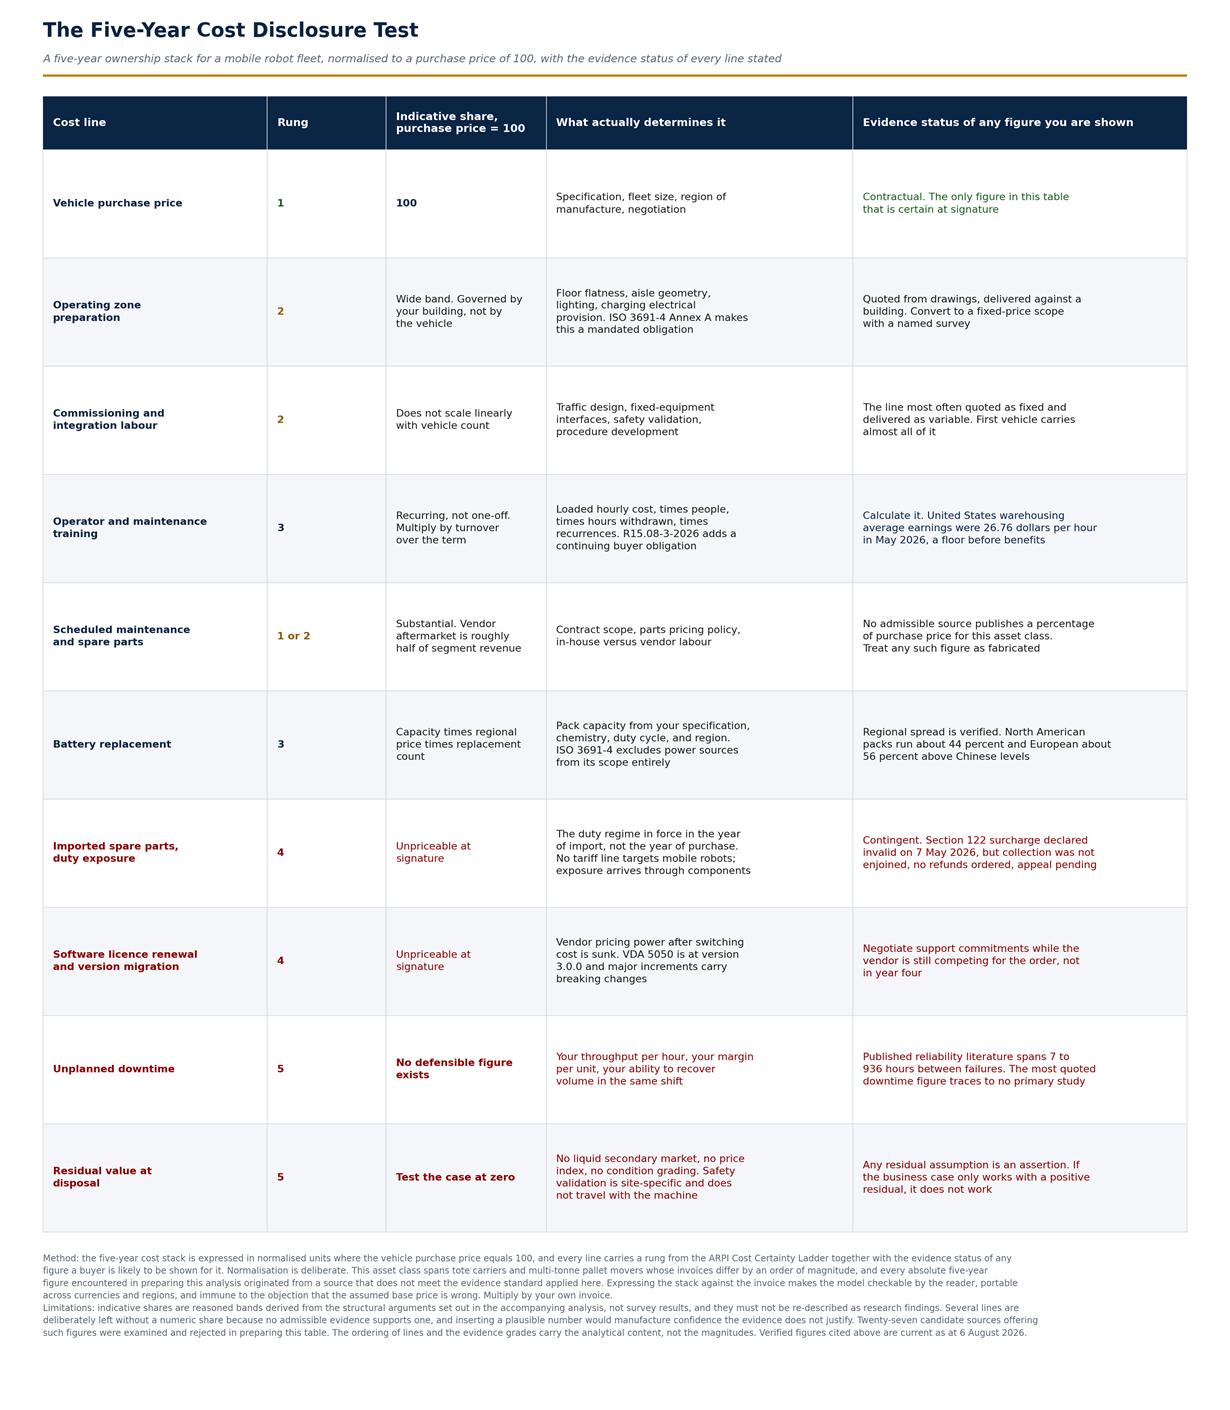
The more important column is the last one. Each line carries a rung from what we term the ARPI Cost Certainty Ladder, which classifies cost lines not by size but by how the number becomes knowable.
Contracted lines are fixed in the agreement before signature. Quoted lines are vendor-stated but not yet binding, and the buyer's task is to convert them or discount them. Derivable lines can be computed from a published rate and a known quantity, which means the buyer should stop asking the vendor and start calculating. Contingent lines are determined later by parties outside the transaction, such as a customs authority or a standards committee. Unknowable lines have no admissible evidence at the moment of signature, and no amount of diligence will produce any.
Table 2: The Cost Certainty Ladder, classifying cost lines by how the number becomes knowable
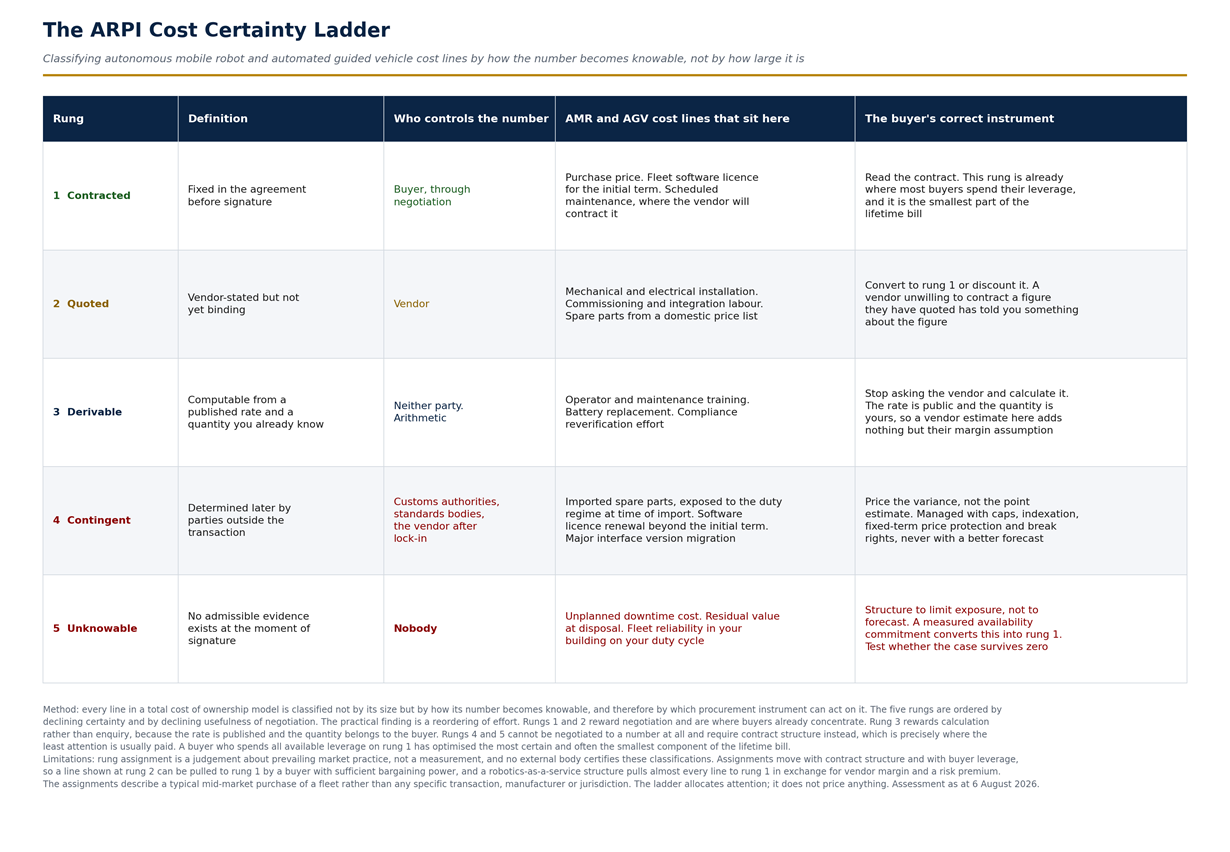
The reordering this produces is the practical value of the whole framework. Most buyers concentrate their leverage on the invoice, which is the most certain and often the smallest part of the lifetime bill. Very little leverage is applied to the contingent and unknowable lines, which is precisely where structure rather than estimation is required. Contingent exposure is managed with caps, indexation clauses, fixed-term price protection and break rights. Unknowable exposure is managed with measured availability commitments and by testing whether the business case survives adverse assumptions. Neither is managed with a better forecast, because a better forecast is not available.
A buyer who applies this ordering will ask a different set of questions. Which of these lines will you contract? For the lines you will not contract, why not? What is the renewal mechanism on the software licence after the initial term, and what caps it? What availability will you commit to, measured in my building, and what happens when it is missed? What is your interface-version support commitment, and for how long? And, most revealing of all, what would you charge me to take all of this as a service instead?
The answers to those questions are worth more than any total cost figure, because they tell you which parts of the lifetime cost the vendor is willing to stand behind. That is the only information in the entire exercise that is genuinely verifiable at the point of signature.
For the buyer weighing whether this asset class deserves capital at all, the calculation extends beyond the cost stack into the structural case for automation itself, which is the subject of the final article in this series.
Disclaimer
This article is published by RobotAIGeek for informational and educational purposes only. It does not constitute investment advice, procurement advice, legal advice, or a recommendation to buy, sell, or specify any product, service, or security. References to safety standards, certification schemes, and conformity obligations are provided for general orientation and do not substitute for conformity assessment by a competent body or for independent legal counsel. The cost frameworks presented here are analytical instruments for allocating buyer attention and are not priced models; indicative shares are reasoned bands rather than survey results, and are expressed relative to purchase price rather than in absolute currency. Standards editions and trade measures are stated as current at the information cut-off date and are subject to change, including through judicial proceedings that remain unresolved. Figures are stated as published by the cited sources, in the currencies and units those sources use, and have not been independently audited. Readers should conduct their own due diligence and obtain independent professional advice before making procurement or investment decisions. Information cut-off: 6 August 2026.